App Influencer Marketing in Practice: What 7 US Weight-Loss Apps Did With 1,640 Creator Ads
What seven US calorie-tracking and weight-loss apps did with 367 creators in three months: how they buy, how often, on which platforms, and what it would cost at market rates.
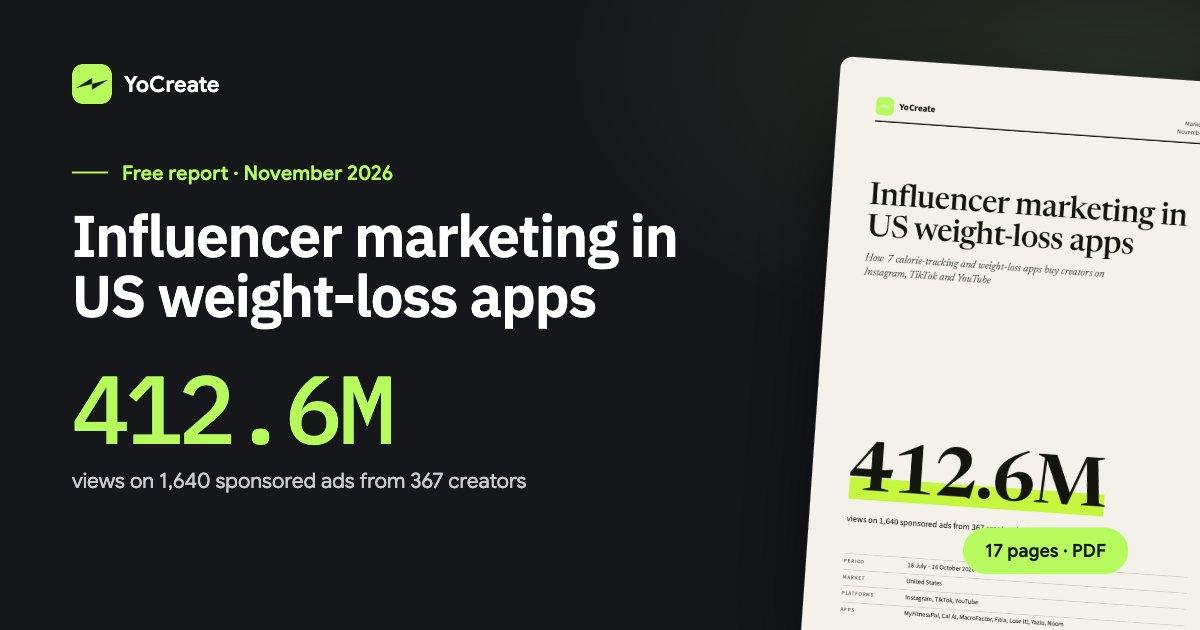
Between 18 July and 16 October 2026, seven US weight-loss and calorie-tracking apps ran 1,640 US-likely sponsored ads from 367 creators, drawing 412.6M views. At market rates that activity would cost about $19.5M in creator integrations, an estimate and not what the brands paid. We run these campaigns (300+ so far) and this study is the research we do before a launch, so here is what it shows about app influencer marketing and what a growth team can copy, with the full US weight-loss apps report holding the rest.
The numbers at a glance
- 7 apps: MyFitnessPal, Cal AI, MacroFactor, Fitia, Lose It!, Yazio and Noom
- 1,640 US-likely sponsored ads (2,377 found across all countries)
- 367 unique creators
- 412.6M views on those ads
- 4.5 ads per creator on average
- About $19.5M estimated cost of creator integrations, plus about $1.1M estimated paid promotion of creator posts. Both are market-rate estimates, not what the brands paid.
- Period: 18 July to 16 October 2026, on Instagram, TikTok and YouTube
These are health and fitness apps buying fitness and nutrition creators, so treat this as fitness influencer marketing at app scale, not a rule for every category.
How to read these numbers
"US-likely" is a proxy: on TikTok it means the video's region is the US, and on Instagram and YouTube it means the caption isn't in another language. Every figure is a lower bound of visible paid activity, because we counted only posts with a clear sign of paid placement and some creators were never reached. Spend is priced at market rates, so it shows what the activity would cost, not what anyone paid. Six of the seven are trackers. Noom is a weight-loss programme next door, included because it visibly buys creators.
This is mobile app influencer marketing in one niche over one quarter. It has views and engagement, not installs or revenue, so it tells you how these apps buy, not how well it worked. The definitions and collection method are in the methodology and all nine charts.
Apps buy creators in bundles, not single posts
The average creator ran 4.5 ads for a brand, usually several posts over several weeks, often on more than one platform. Where we could match creators across platforms by an identical handle, 17% ran the same brand on two or more platforms, and they account for 24% of ads. The real share is higher, because creators with different handles on different platforms can't be linked.
So ad count overstates the number of deals. MyFitnessPal has 296 ads from 100 creators, 3.0 each. MacroFactor has 651 ads from 69 creators, 9.4 each. On ads alone MacroFactor looks more than twice as big. On creators, MyFitnessPal is wider.
When you size up a competitor, count creators and ads per creator first. Ad volume is the weakest of the three numbers.
Two ways to buy: personal codes or labelled partnerships
Apps recognise their creator ads in one of two ways. Across all seven brands, 73% of ads carry a personal creator or promo code, and 21% are identifiable mainly by a disclosure label (#ad, "paid partnership" or the platform's flag).
Cal AI is the code end: 97% of its ads carry a code. MyFitnessPal is the label end: 59% carry a disclosure label, and about 125 of its 296 ads come from a student-athlete programme run through the Postgame platform. Noom mixes both. 55% of its ads carry a code and 38% a label, and 28 of its 47 ads are sponsor reads on YouTube podcasts.
Our read, as people who set up tracking for a living: a code buyer is tracking by creator. Each creator has their own code, so you can compare them on redemptions and cut the weak ones. A label buyer is buying a managed programme, where the unit is the cohort and results are reported at programme level. Neither is better. You choose based on whether you need creator-level comparison or a coordinated launch, and that choice sets how much you can learn from each creator. Our influencer analytics and attribution work starts from that decision.
Always-on or in waves: two buying rhythms
MacroFactor buys 40 to 66 ads every week, with a median of 50.5. Cal AI buys 23 to 37 every week. Together they form a base of roughly 80 ads a week, with new creators joining at a steady rate and the volume barely moving.
MyFitnessPal combines both rhythms. It runs an always-on base of 15 to 20 ads a week, then a September wave: 37 creators posted for the first time in the week of 7 September, 18 more joined the week after as the athlete programme started, and that week reached 72 ads. Lose It! works only in bursts. It had ads in 5 of 12 weeks, and 21 of its 32 ads fell in two of them.
Across all seven brands that adds up to 91 to 160 ads a week with no upward or downward trend: a steady base with campaign waves on top.
For a launch plan, choose a base cadence first, then add a burst around a launch or a new programme. A burst without a base leaves weeks of silence between posts, and a base with no waves has nothing to peak around. Setting that cadence early is part of our campaign management work.
One brand, one platform: how MacroFactor built 651 ads
About three quarters of MacroFactor's ads are on YouTube, from roughly 70 creators on long-running sponsorships. Some channels repeat the same sponsor line and code in the description of every video, which is why the count runs high. YouTube brings 88% of its views, and two channels account for more than a third of its ads (135 and 106 of 651).
Cal AI works with a similar number of creators, 79, but gets 5.0 ads from each. Same creator count, very different buying style.
Ads, creators and views also rank the brands differently. By views it is MacroFactor at 149.8M, Cal AI at 122.6M and Noom at 93.1M from only 47 ads. Views depend on a handful of very large placements, so a competitor's view total says little about how many deals sit behind it.
Platform mix: Instagram and YouTube carry the ads, TikTok the fewest
By ad count, Instagram has 46%, YouTube 42% and TikTok 12%. By views, Instagram has 53%, YouTube 41% and TikTok 6%.
The mix differs by brand. MacroFactor sits on YouTube. Cal AI, Fitia, Yazio, Lose It! and Noom get most of their views from Instagram. Noom is the sharpest case: it ran 60% of its ads on YouTube, yet Instagram brought 98% of its views.
One caveat. TikTok was the hardest platform to collect. Keyword search found only about 1 in 10 of TikTok creators' ads, so we added a creator-by-creator scan. TikTok's share is a minimum, though even after the scan it is the smallest of the three.
Comment-for-link funnels are rare
About 4% of Instagram ads (28 of 760) send people to the app link through a "comment a word, get the link" funnel, and 23 of those 28 come from one creator. Captions understate the real share, because the call to action is often spoken or on screen and the bot's reply sits in comments and DMs, which we didn't collect.
When reach looks paid: the Noom case
Noom's Instagram creators are ordinary-sized, with a median of about 113K followers. Yet its median Instagram ad got 850,517 views, against 57,638 for Cal AI. That is roughly 8 views per follower, against 0.1 to 0.5 for the other brands, and the lowest engagement rate in the set at 0.7% on Instagram.
Reach far above audience size with low engagement is the usual sign of paid amplification of creator posts. We estimate that paid promotion brought 92% of Noom's views across Instagram and TikTok, and 94 to 95% on Instagram alone. A control check on the same creators' ordinary posts shows both signals on about 3% of those posts.
This is an estimate on a small sample: 18 Instagram ads from 12 creators, not confirmed through ad libraries. Treat it as a flag, not a finding.
Ask for the paid-versus-organic split on every creator deal. If a post reaches 8 times the creator's follower count, someone put money behind it, and you should know whether that was you. We run whitelisting for this reason, putting paid ads behind posts creators have already published, so we plan that split from the start.
What this would cost at market rates
Priced at US influencer rates for creator integrations and US paid-traffic rates for boosting, three months of this activity comes to an estimated $19.5M plus about $1.1M of paid promotion of creator posts. This is what the activity would cost, not what the brands paid.
MacroFactor and Cal AI make up about 80% of the total, mostly because of their view volume. MyFitnessPal and Cal AI, counted as one buyer since the acquisition announced in March 2026, come to an estimated $9.3M, ahead of MacroFactor at an estimated $8.4M (the report's per-app figures keep the two separate). About $1.0M of the $1.1M paid-promotion estimate sits with Noom.
Two caveats. MacroFactor's YouTube figure is an upper estimate, since long-running sponsorships like these are usually paid as a flat fee or a share of sales, not per view. And the paid-promotion figure still needs confirming.
Want the spend by brand and format? It is in the full report.
Influencer marketing for apps: what a growth team can take from this
- Count creators, not posts. Ads per creator and unique creators tell you more about a competitor's programme than ad volume.
- Decide on codes or labels before you brief. It determines whether you can compare creators or only compare cohorts.
- Choose a base cadence, then add waves for launches. Always-on and burst buyers are both in this set. Combining them is what MyFitnessPal's September looks like.
- Ask for the paid share. Get paid versus organic views in every deal, so you know what your reach actually cost.
- Read a competitor's reach against creator size. Views far above audience size usually means someone is paying for distribution.
Creator-level comparison only works if tracking is set up before the campaign starts. On Nebius we put end-to-end tracking in place and reported weekly; here is how we reported 360% ROMI for Nebius. It is a different category, so read it only as a point about reporting.
Numbers to benchmark against
Observed in this niche, not industry benchmarks:
- 4.5 ads per creator on average
- Programmes of 15 to 100 creators in three months
- 73% of ads carry a code, 21% a label
- A platform mix of 46% Instagram, 42% YouTube and 12% TikTok by ads
Get the full report
The PDF covers what we kept out of this article: nine charts, estimated spend by brand and by format, the top 20 creators, an example for every finding, and the full methodology. Download the full US weight-loss apps report.
Cite as: YoCreate, Influencer marketing in US weight-loss apps, November 2026. Source: yocreate.com/reports/us-weight-loss-apps.
Frequently asked questions
How much do apps spend on influencer marketing?
In our study, the seven apps' visible creator activity would cost an estimated $19.5M for integrations plus about $1.1M for paid promotion of creator posts over three months (18 July to 16 October 2026). These are market-rate estimates of what the activity would cost, not what the brands paid.
How do app brands track creator performance?
Two main models. About 73% of ads in the study carry a personal creator or promo code (Cal AI: 97%), which lets a brand compare creators one by one. About 21% are identified mainly by a disclosure label or paid-partnership flag (MyFitnessPal: 59%), which fits a managed programme reported at cohort level.
Which platform do apps use most for influencer ads?
By ad count, Instagram has 46%, YouTube 42% and TikTok 12%. By views, Instagram has 53%, YouTube 41% and TikTok 6%. TikTok's share is a minimum, because it was the hardest platform to collect and keyword search found only about 1 in 10 of its creators' ads.
Do app influencer campaigns run continuously or in bursts?
Both. MacroFactor and Cal AI buy every week of the quarter. MyFitnessPal runs an always-on base of 15 to 20 ads a week plus a September wave that reached 72 ads in one week. Lose It! had ads in only 5 of 12 weeks, and most of its ads fell in two of them.
How can you tell if an influencer post has been boosted with paid ads?
Reach far above the creator's audience size, together with low engagement, is the usual sign of paid amplification. In the study, Noom's median Instagram ad had about 8 views per follower, against 0.1 to 0.5 for the other brands. That is an estimate on a small sample (18 ads, 12 creators) and was not confirmed through ad libraries.

YoCreate Team
Influencer Marketing & Creator Growth
Run your next influencer campaign with YoCreate
Find vetted creators, manage campaigns end to end, and measure real results.